

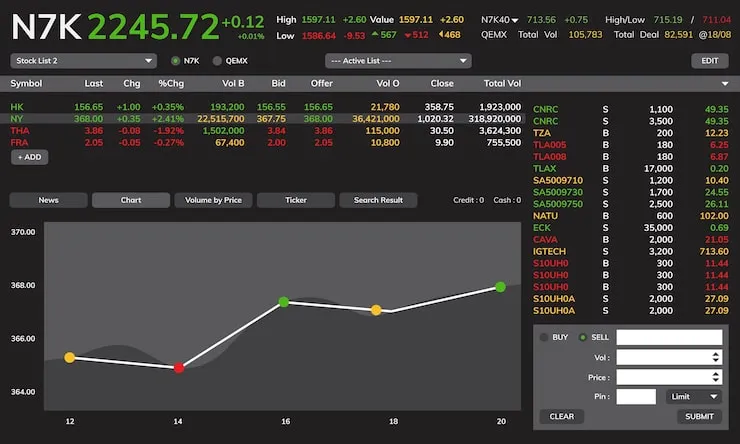
Price charts show plain facts about market trends without extra noise. Every single day, thousands of traders rely on stock market chart analysis to track real visual patterns, spot price support levels, and find clear entry points. Green and red bars tell stories about supply and demand. You can learn these basic patterns quickly. Simple tools reveal clear trend directions when buyers step in strongly. Daily practice helps build real confidence faster than reading long news reports. Visual data helps traders act with calm focus and make better market choices consistently.
Basics of Reading Stock Charts
Stock charts display price movements over clear time frames like minutes, hours, or full days. Line charts offer simple overall paths, while Japanese candlesticks show open, high, low, and close prices clearly. Understanding these basic shapes gives you a massive advantage. Green candles show rising prices where buyers win the session. Red candles mark falling prices controlled by strong sellers. Small wicks indicate price stability, while long wicks show rapid price rejection. Studying these visual clues regularly helps you notice key market shifts before major trend updates happen.
Understanding Support and Resistance Levels
Price levels often pause or bounce at familiar visual price floors and ceilings. Support acts like a strong floor where buyers enter to stop sharp drops. Resistance works like a firm ceiling where sellers take quick profits. Finding these exact horizontal lines builds a solid routine. When price breaks above a ceiling, that old level often becomes a new supportive floor. Identifying these key boundary points helps structure better trade setups. Smart chart reading depends heavily on watching how prices test these major visual boundaries again.
Using Free Technical Analysis Tools
Modern web platforms make basic tools accessible without high software subscription costs. Anyone can start using free technical analysis indicators like moving averages, relative strength index, and volume bars today. Moving averages smooth out wild daily price swings to show true underlying directions clearly. Volume bars at the bottom confirm whether big market players support a price move. Simple indicators work best when kept clean on your main screen. Combining two simple tools provides quick clarity without creating overwhelming visual clutter during busy trading hours.
Recognizing Common Chart Patterns Daily
Chart patterns repeat because human trading habits remain steady across cycles. Double bottoms look like clear letter shapes and signal possible upward turns. Head and shoulders patterns often alert traders to upcoming downward price reversals. Spotting these recognizable shapes gives actionable clues for potential price swings. Triangles show tightening price ranges right before strong momentum breakouts occur. Watching pattern formations take shape helps traders prepare strategic plans early. Regular chart practice makes recognizing these geometric market shapes second nature over time for disciplined market participants.
Importance of Volume in Trading
Trading volume reveals the true hidden strength behind any price movement on screen. High volume during a price breakout shows strong institutional commitment to that new path. Low volume during a breakout often signals a weak false move that might fail soon. Checking volume bars prevents jumping into risky trap trades prematurely. A steady rise in trading activity confirms that buyers or sellers are fully active. Always check volume levels alongside price action before taking any major market position during active trading sessions across markets.
Managing Risk With Chart Signals
Chart analysis helps protect trading capital by pinpointing precise exit points for losses. Setting stop-loss orders just below key support levels limits potential financial downside. Chart levels show exactly where a trading idea becomes completely invalid. Calculating potential risk against potential reward ensures smart money management on every single trade. Professional traders always protect capital first before chasing speculative market gains. Following strict chart rules removes emotional stress and keeps trading discipline strong through changing market conditions during highly volatile trading weeks.
Conclusion
Learning to read price charts turns market charts into clear visual maps for traders. Focusing on clean support lines, simple patterns, and reliable volume signals builds solid trading skills over time. Free web tools make charting accessible for everyone starting out. Staying patient and tracking setups daily builds strong market discipline. For more practical guides and financial tools, visit finec.in to continue your educational learning journey. Keep practicing consistently every day, follow your simple trade rules, and manage risk wisely on every trade you take in the future.